Share This Post:
Image Credit: Ricardo Gomez Angel
June 2020 ABI Score Released
June 2020 ABI Score
This is post 5 of 7 in the series ABI Monthly Updates
This is post 5 of 7 in the series
ABI Monthly Updates
WORLD NEWS | Carolyn Feinstein | July 31, 2020
WORLD NEWS | Carolyn Feinstein
July 31, 2020
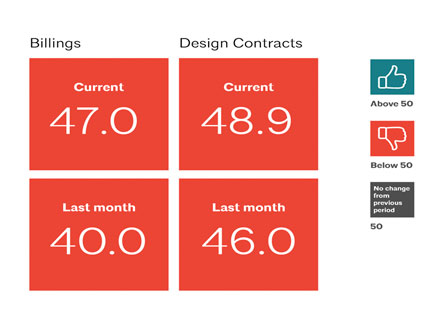
The AIA Economics & Market Research Group released the June 2020 Architectural Billing Index (ABI) and although we are still in the red, the numbers are more positive than last month. The ABI reached 40.0 for the month of June, compared to the May slump of 32.0, and is a welcomed sight from the April low of 29.5. Design contracts were also up to 44.0, a pretty steep increase from the low in March of 27.1, and even May's 33.1.

Image Credit: AIA
I think we can take this as a major win for the industry, considering the BEA's 2nd quarter 2020 GDP numbers, released July 30, 2020, reflected 2Q annual rate decrease on 32.9% (below). The BEA will release a second estimate for the quarter, compiled from more complete data, on August 27, 2020. The decline in the GDP is being attributed to the "stay at home" orders relating to the COVID-19 pandemic. The economic effects of the pandemic response cannot be quantified independently of the general economic data as "the impacts are generally embedded in source data and cannot be separately identified," per the BEA.
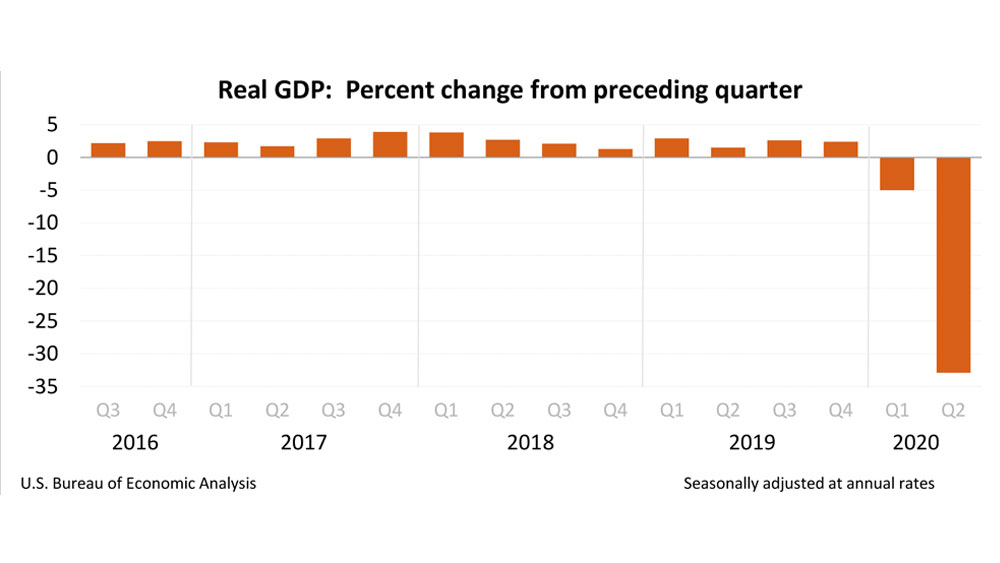
Image Credit: U.S. Bureau of Economic Analysis
Considering any ABI score below the 50 mark means a decline, these scores have yet to reflect growth or industry performance comparable to the average from the previous 12 months. However, this uptick in billings and available work could mean less of a loss of employment to architects and other firm staff. Per the June Report, 38% of firms anticipate reducing staff by the end of the fiscal year, but 17% are thinking staffing levels will increase. The graph below breaks down these expected changes in staffing by specialization, noting the commercial/industrial specialty responded with the highest affirmation of expecting to decrease the numbers of positions within their firms.
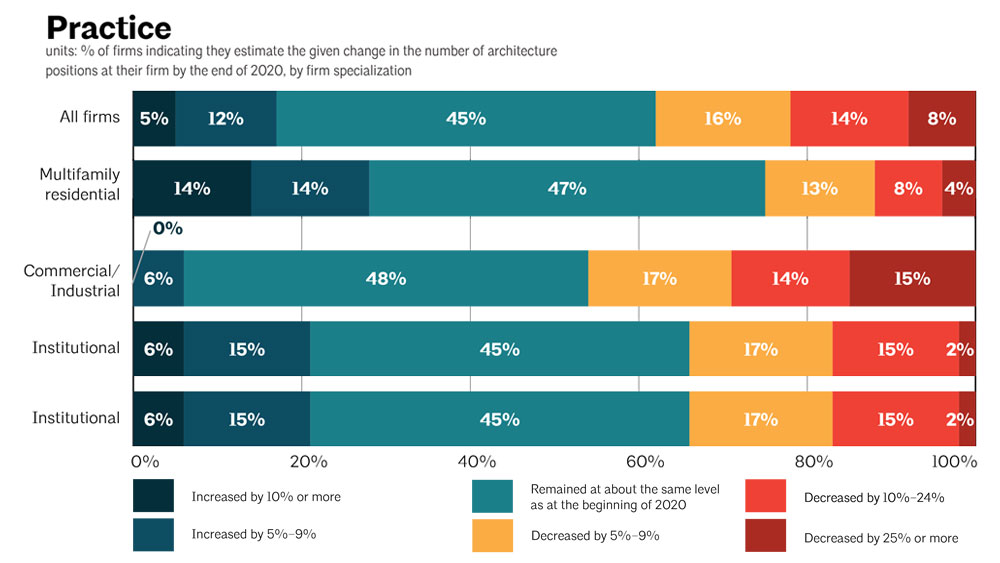
Image Credit: AIA
Employment numbers across the nation are on an upward trend, with the national unemployment rate declining to 11.1% in June, per the Bureau of Labor Statistics (BLS). This is good news, but we need to keep in mind that per the May 2020 data (last chart available) some states were well above this national average, like Nevada (an astounding 25.3%), Hawaii (22.6%), and Michigan (21.2%). This average is pulled up by states like Nebraska, who reported the lowest unemployment in the U.S. at 5.2%.
The most drastic improvement since last month was seen in the Northeast region of the U.S., with an increase in ABI from 25.1 to 34.2. Although the Northeast remains the lowest performing, it is the only one of the four regions that consistently experienced month over month rises in ABI since April. The Midwest was not far behind with a 7.1 point increase to 36.8, matching the performance of the Western region. The Southern region gained 5.3 points to report an ABI of 35.9.
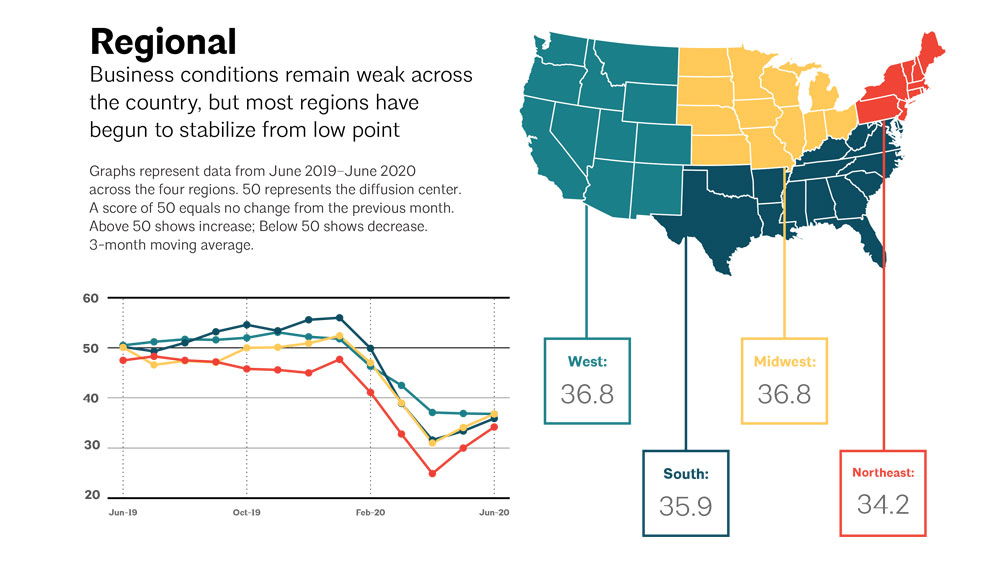
Image Credit: AIA
So can we consider this a light at the end of the tunnel, or simply a positive bump in the road? There is no hard and fast answer at present, but I took a long deep breath and decided to optimistically judge this as an upward trend. Even if this rise turns out to be short lived, it will serve as a good reminder that the industry and economy will rebound.


