Share This Post:
Image Credit: Ej Yao
August 2020 ABI Score
August 2020 ABI Score
This is post 3 of 7 in the series ABI Monthly Updates
This is post 3 of 7 in the series
ABI Monthly Updates
WORLD NEWS | Carolyn Feinstein | September 30, 2020
WORLD NEWS | Carolyn Feinstein
September 30, 2020
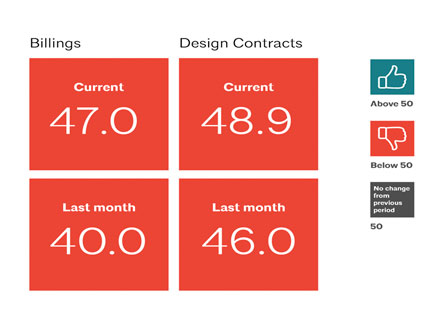
It's not bad news, but it's not necessarily good either. For the third consecutive month, the Architectural Billing Index (ABI) has stalled at below-growth levels (a score of 51 or above) according to the AIA Economics & Market Research Group. The billing score nationwide has stalled at 40.0, while there was a modest increase in the value of design contracts, rising from 41.7 to 46.0.
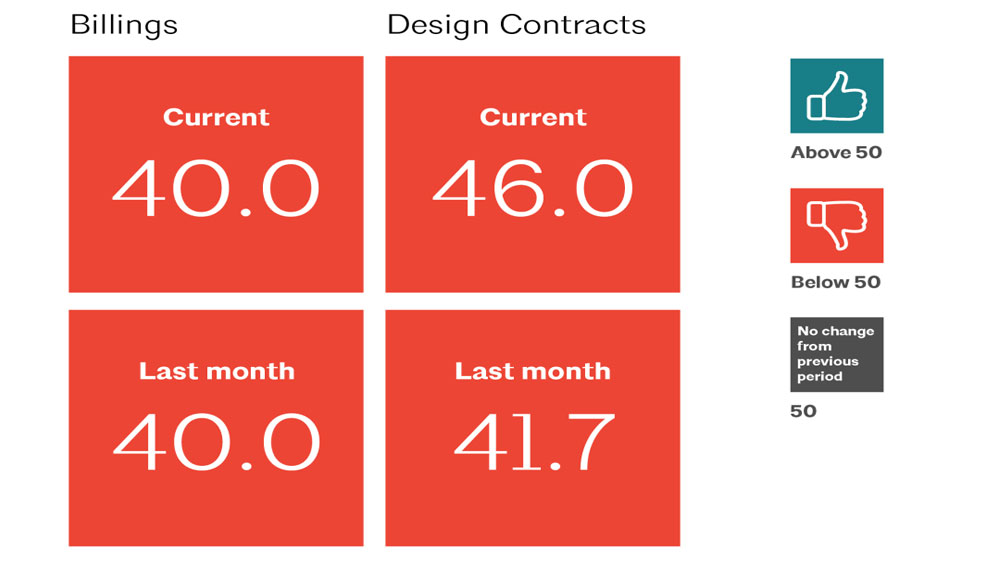
Image Credit: AIA
The national billing index remained at 40.0, the same score as June and July. From the all-time low of 29.3 in April of 2020, the 40.0 ABI should provide a sense of promise, but this three month stall, at this recessed level, reflects the reality of the continuing soft market conditions and a slow recovery.
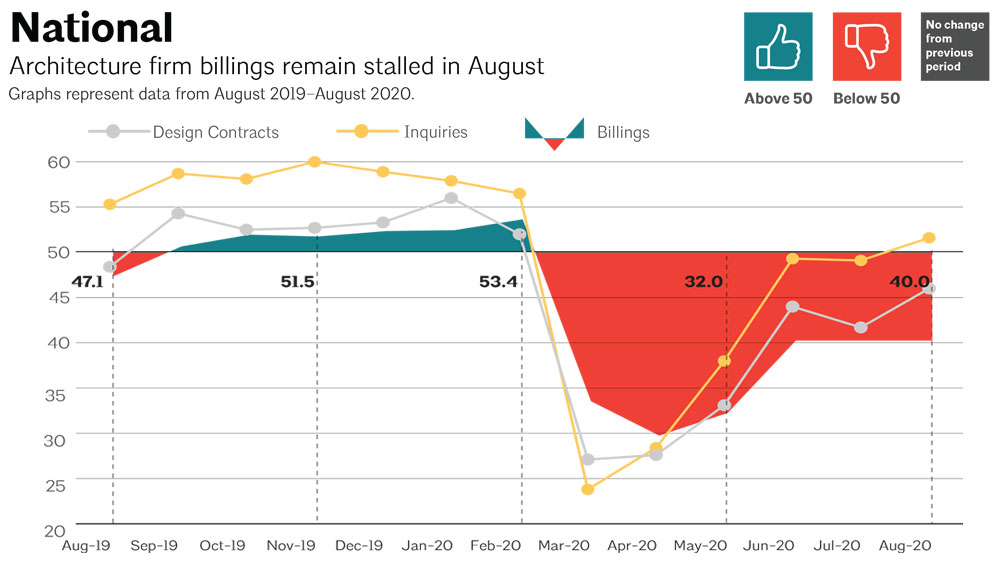
Image Credit: AIA
Looking a bit deeper into the national score, this average is actually being dragged down by the unfortunate conditions in the Northeast region. The Northeast saw a disappointing score of 33.9 for August (a further decline from the July score of 36.8), whereas the other three regions experienced modest growth. The Midwest boasted the largest regional gain from July to August, going from 40.1 to 41.7. The West saw an increase of 0.4 (from 40.9 to 41.3), while the South rose from 40.7 in July to 41.6 in August.
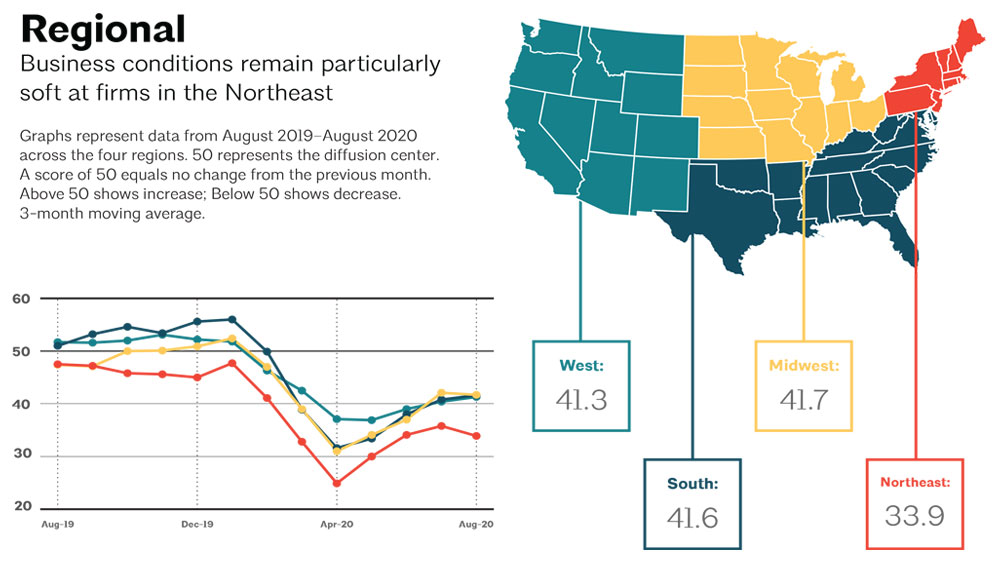
Image Credit: AIA
Not surprisingly, nonfarm payroll is still 7.6% below the pre-pandemic levels, but it was able to regain 1.4 points during the month of August. However, the architectural services industry lost another 6,000 positions during the month of July (the latest available data as the industry-specific numbers have a one month lag). Since the onset of the pandemic, the industry has shed a total of 16,900 positions. At current employment numbers of 183,100 in the industry, it is the lowest employment level in four years.
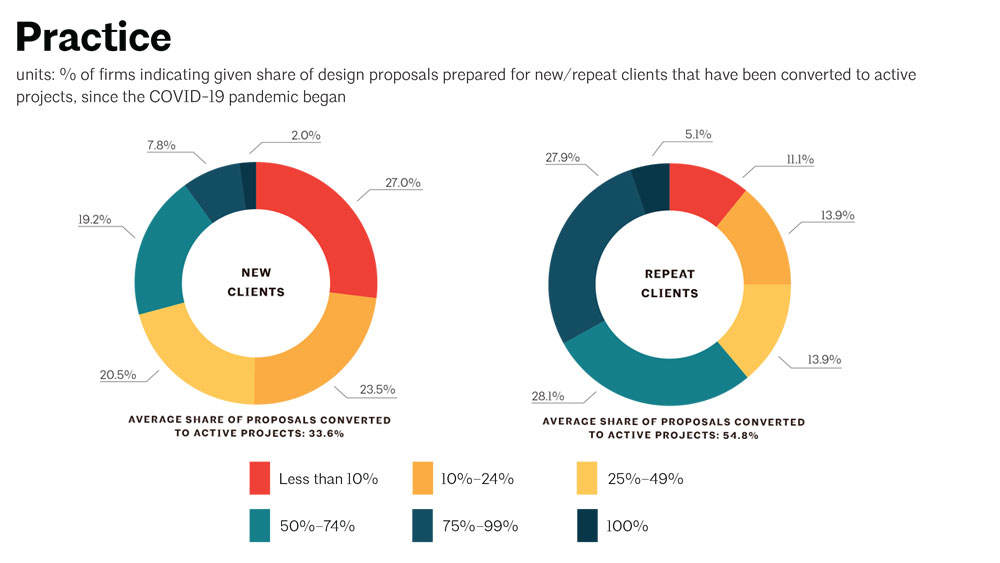
Image Credit: AIA
This month's survey inquired specifically about the conversion of proposals to design contracts since the beginning of pandemic. According to respondents, since the beginning of the pandemic, repeat clients are 20.2% more likely to sign on the dotted line for new projects. Per the report, 33.6% of proposal conversions are from new clients, where repeat clients accounted for 54.8% of the same. Perhaps in a volatile time, clients are relying on familiar names they feel they can trust. This may be a hard pill to swallow for new firms still looking to expand their book of business, but stresses the importance of building lasting relationships with each client that crosses our path.
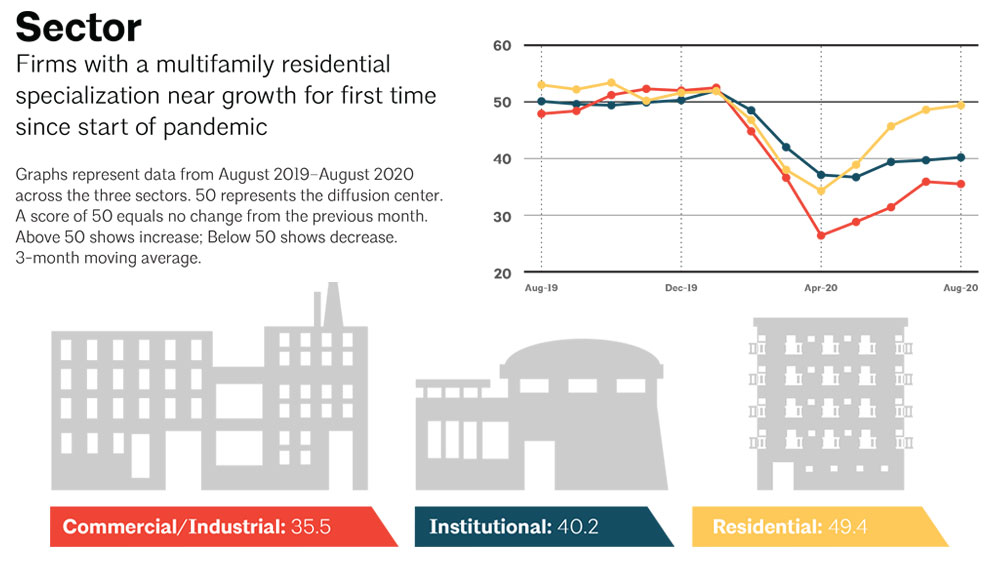
Image Credit: AIA
To end on a high note, the multi-family residential sector reported a score of 49.4, teetering on the edge of growth in overall billings. The sector reported a July score of 47.5, showing there is promise in the short term of returning to a positive growth position. The commercial and industrial sector is down across the country, with real estate sales receding and construction activities at a halt. The institutional sector remained at a nearly stable score of 40.2, compared with the 39.5 of the previous month.


